Carbon dioxide flooding

Carbon dioxide (CO2) flooding is a process whereby carbon dioxide is injected into an oil reservoir in order to increase output when extracting oil.

Carbon dioxide flooding

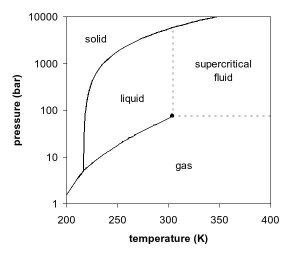
When a reservoir’s pressure is depleted through primary and secondary production, Carbon Dioxide flooding can be an ideal tertiary recovery method. It is particularly effective in reservoirs deeper than 2,000 ft., where CO2 will be in a supercritical state, with API oil gravity greater than 22–25º and remaining oil saturations greater than 20%. It should also be noted that Carbon dioxide flooding is not effected by the lithology of the reservoir area but simply by the reservoir characteristics. Carbon dioxide flooding works on the premise that by injecting CO2 into the reservoir, the viscosity of any hydrocarbon will be reduced and hence will be easier to sweep to the production well.

If a well has been produced before and has been designated suitable for CO2 flooding, the first thing to do is to restore the pressure within the reservoir to one suitable for production. This is done by injecting water (with the production well shut off) which will restore pressure within the reservoir to a suitable pressure for CO2 flooding. Once the reservoir is at this pressure, the next step is to inject the CO2 into the same injection wells used to restore pressure. The CO2 gas is forced into the reservoir and is required to come into contact with the oil. This creates this miscible zone that can be moved easier to the production well. Normally the CO2 injection is alternated with more water injection and the water acts to sweep the oil towards the production zone. The Weyburn oil field is a famous example where this method is applied in financially interesting conditions.

CO2 flooding is the second most common tertiary recovery technique and is use in facilities around the world. In the scope of global warming, it is an available method to curb CO2 emissions.

From http://en.wikipedia.org/

Carbon dioxide equivalent

Carbon dioxide equivalent (CDE) and Equivalent carbon dioxide (or CO2e) are two related but distinct measures for describing how much global warming a given type and amount of greenhouse gas may cause, using the functionally equivalent amount or concentration of carbon dioxide (CO2) as the reference.

Global Warming Potential

Carbon dioxide equivalency is a quantity that describes, for a given mixture and amount of greenhouse gas, the amount of CO2 that would have the same global warming potential (GWP), when measured over a specified timescale (generally, 100 years). Carbon dioxide equivalency thus reflects the time-integrated radiative forcing, rather than the instantaneous value described by CO2e.

The carbon dioxide equivalency for a gas is obtained by multiplying the mass and the GWP of the gas. The following units are commonly used:

* By the UN climate change panel IPCC: billion metric tonnes of CO2 equivalent (GtCO2eq).
* In industry: million metric tonnes of carbon dioxide equivalents (MMTCDE).
* For vehicles: g of carbon dioxide equivalents / km (gCDE/km).

For example, the GWP for methane over 100 years is 25 and for nitrous oxide 298. This means that emissions of 1 million metric tonnes of methane and nitrous oxide respectively is equivalent to emissions of 25 and 298 million metric tonnes of carbon dioxide.

Equivalent carbon dioxide

Equivalent CO2 (CO2e) is the concentration of CO2 that would cause the same level of radiative forcing as a given type and concentration of greenhouse gas. Examples of such greenhouse gases are methane, perfluorocarbons and nitrous oxide. CO2e is expressed as parts per million by volume, ppmv.

CO2e calculation example:

* The radiative forcing for pure CO2 is approximated by RF = αln(C / C0) where C is the present concentration, α is a constant, 5.35 and C0 the pre-industrial concentration, 278 ppm. Hence the value of CO2e for an arbitrary gas mixture with a known radiative forcing is given by C0exp(RF / α) in ppmv.
* To calculate the radiative forcing for a 1998 gas mixture, IPCC 2001 gives the radiative forcing (relative to 1750) of various gases as: CO2=1.46 (corresponding to a concentration of 365 ppmv), CH4=0.48, N2O=0.15 and other minor gases =0.01 W/m2. The sum of these is 2.10 W/m2. Inserting this to the above formula, we obtain CO2e = 412 ppmv.

From http://en.wikipedia.org/

List of countries by carbon dioxide emissions per capita

List of countries by carbon dioxide emissions per capita

This is a list of countries by carbon dioxide emissions per capita from 1990 through 2004. All data were calculated by the US Department of Energy's Carbon Dioxide Information Analysis Center (CDIAC), mostly based on data collected from country agencies by the United Nations Statistics Division.

For some countries, figures are unavailable; their levels of carbon dioxide emissions have been estimated where noted. Some dependencies and territories whose independence has not been generally recognized are also included, as they are in source data.

Countries are ranked by their metric tons of carbon dioxide emissions per capita in 2004.

From http://en.wikipedia.org/

List of countries by carbon dioxide emissions

List of countries by carbon dioxide emissions

This is a list of sovereign states by carbon dioxide emissions due to human activity. The data presented below corresponds to emissions in 2004. The data itself was collected in 2007 by the CDIAC for United Nations. The data considers only carbon dioxide emissions from the burning of fossil fuels, but not emissions from deforestation, and fossil fuel exporters, etc.

List of countries by carbon dioxide emissions

These statistics are rapidly dated due to huge recent growth of emissions in Asia. The United States is the 10th largest emitter of carbon dioxide emissions per capita as of 2004. According to preliminary estimates, since 2006 China has had a higher total emission due to its much larger population and an increase of emissions from power generation. China is the 91st largest emitter of carbon dioxide emissions per capita as of 2004.

Some dependencies and territories whose independence has not been generally recognized are also included, as they are in source data.

Certain entities are mentioned here for purposes of comparison. These are indicated in italics and are not counted in the ordering of sovereign states. (See also: carbon cycle)

From http://en.wikipedia.org/

Carbon budget

Carbon budget refers to the contribution of various sources of carbon dioxide on the planet, and has nothing to do with political agendas, climate change legislation, carbon controls, carbon storage, or geopolitical carbon footprint.

Balancing the Carbon Budget

Carbon budget figures are normally documented by mass of carbon. Documenting carbon budget figure by mass of carbon dioxide is limiting as sometimes the transfer of carbon from one system to another is via a compound other than carbon dioxide. Carbon dioxide mass inputs (eg. IPCC, 2007) can be too easily misread. The 28,556 megatonnes of carbon dioxide chalked up to fossil fuel combustion by the IPCC represents only 7.8 GtC annually.

Carbon Sources (Annual)

* 80.4 GtC by soil respiration and fermentation (Raich et al., 2002)
* 38 GtC and rising by 0.5 GtC per annum by cumulative photosynthesis deficit(Casey, 2008)
* by post-clearance deflation (See Eswaran, 1993)
* 7.8 GtC (IPCC, 2007 - Needs peer reviewed reference)
* 2.3 GtC by process of deforestation (IPCC, 2007; Melillo et al., 1996; Haughton & Hackler, 2002)
* 0.03 GtC? by Volcanoes
* by Tectonic rifts
* by Animal Respiration
* by Plant Respiration

Carbon Sinks (Annual)

* 120 GtC by Photosynthesis (Bowes, 1991)
* By Ocean Carbonate Buffer

Cumulative Photosynthesis Deficit

Carbon pooled in photosynthesising biota is 560 GtC (Schlesinger, 1991). Carbon released by deforestation between 1850-2000 is 156 GtC (Haughton & Hackler, 2002), reducing the total photosynthesising biomass to 540 GtC in 2000.

Reduction in photosynthesis between 1850-2000: 156 / (540 + 156) = ~22%
120 = (100-22=78)% of 154 GtCpa - a difference of ~34 GtCpa in 2000

Given the increase of 0.5 GtCpa over the past eight years since 2000, this figure would be closer to 38GtCpa in 2008.

From http://en.wikipedia.org/

Cap and Share

Cap and Share was originally developed by Feasta (the Foundation for the Economics of Sustainability) and is a regulatory and economic framework for controlling the use of fossil fuels in relation to climate stabilisation. Accepting that climate change is a global problem and that there is a need to cap and reduce greenhouse gas emissions globally, the philosophy of Cap and Share maintains that the earth’s atmosphere is a fundamental common resource. Consequently, it is argued, each individual should get an equal share of the benefits from the limited amount of fossil fuels that will have to be burned and their emissions released into the atmosphere in the period until the atmospheric concentration of greenhouse gases has been stabilised at a safe level.

This market based mechanism was devised by Feasta in 2005 and 2006, and they have set out the case for the introduction of Cap and Share globally in policy documents.It calls for global emissions to be capped at their current level and then brought down year by year at a rate fast enough to prevent catastrophic climate change. Each year, the emissions tonnage involved would be shared equally amongst the Earth's adult population, each of whom would receive a certificate representing their individual entitlement. The recipients would then sell their certificates through the banking system to oil, coal and gas producers who would need to acquire enough of them to cover the carbon dioxide emissions that would be emitted from all of the fossil fuel they sold. Everyone would receive at least partial compensation for the higher cost of fossil fuels that limiting their availability would necessarily involve.

Comhar, the National Sustainable Development Council of Ireland, have commissioned a report on the mechanism which incorporates policy and economic analysis of using Cap and Share to control emissions in Ireland, particularly from the transport sector. The final report is due to be published in December 2008.

Cap and Share is partly an extension and popularisation of the Contraction and Convergence proposal developed by the Global Commons Institute, which also calls for an equal per capita distribution of emissions. Cap and Share differs in that it insists that emissions allocations should be distributed equally to individuals as their right, whereas Contraction and Convergence (C&C) allows governments to decide if this is the way they wish to share out what is, essentially, their national allocation. C&C also allows for (but does not insist on) a convergence period, during which the richer countries would receive higher per capita emissions allowances than poorer countries. Cap and Share says people in rich countries should get the same emissions entitlement as those in poor countries from the start, but suggests that in the early years of the system, a portion of everyone's emissions entitlement should be held back and distributed to governments of countries which were facing exceptional difficulties in adapting to climate change or to low levels of fossil energy use. The governments involved would sell their certificates to raise money for remedial works. For example, the government of Bangladesh might sell its allocation to pay for better defences against rising sea levels.

The diagram below sets out the basic process of the policy:

Cap and Share

The policy

Principles

1. That a ceiling or cap on carbon dioxide and other green house gas (ghg) emissions from fossil fuels should be calculated that prevents an average global temperature rise of over 2 degrees Celsius.

2. That the right to emit such ghgs is a human right, and should be shared on an equal-per-capita basis, with permits going to each individual rather than to their governments.

3. That the permits would be saleable through the post office and banking system to the importers and producers of fossil fuels who would need to acquire enough permits to cover the emissions from the fuels they introduce.

4. That any national or European Union scheme should be designed as a possible prototype for a global system that will also help set the conditions for the alleviation of poverty and the maintenance of biodiversity.

Economic assessment

If the future were known with certainty, then the economic implications of Cap and Share would equal the economic implications of a carbon tax with lump sum recycling -- that is, the carbon tax revenue would be used to send every household a cheque in the post. Some argue that lump sum recycling is an inferior way to recycle the revenue of environmental taxes, and that this has been repeatedly confirmed for Ireland. The rationale is that with the carbon tax revenue coming into government coffers, it could be directly spent by the government rather than distributed to the population via cheques, and that other kinds of taxation, such as labour taxation, could be decreased correspondingly. It is argued that this would have a positive effect on GDP since there would be a greater incentive for firms to increase employment, and that it would also positively affect social equity, since labour taxes are regressive by nature.

The NGO that developed Cap and Share, Feasta, argues that while it is definitely a good idea to shift the tax burden away from labour and towards capital, a carbon tax is not the optimal instrument for this purpose. Carbon taxes do not establish a predictable level of emissions cuts, unlike a cap, and can be vulnerable to short-term political pressures such as an increase in the price of oil, since a country's tax policy is usually adjusted each year in the annual Budget. Feasta suggests that if a carbon tax were to be introduced, it would work best in tandem with Cap and Share. The two policies could be used to help countries fine-tune their responses to climate change and Peak Oil.

Feasta also advocates the introduction of a land-value-based tax, which they believe could be used as a substitute for taxation on labour and could therefore have a similar effect on the market to a carbon tax.

As the future is not known with certainty, some argue that cap and share has all the drawbacks of quantity-based regulation for a stock pollutant. In the case of greenhouse gas emissions, the argument goes, price-based regulation (incl. a carbon tax with lump-sum recycling) is more robust to uncertainty and leads to lower welfare losses.. Again, however, Cap and Share advocates argue that the problem of assuring that specific emissions targets are reached is not properly addressed by using a purely price-based mechanism for emissions reduction. From their perspective, a definite, substantial decrease in greenhouse gas emissions, carried out in an equitable way so that the poor are not adversely affected, is well worth a possible decrease in "welfare" as measured by GDP (a highly problematic instrument for measuring wellbeing

From http://en.wikipedia.org/

Black Sea deluge theory

Black Sea deluge theory

The Black Sea deluge is a hypothesized prehistoric flood that occurred when the Black Sea filled rapidly circa 5600 BC. The hypothesis made headlines when The New York Times published it in December 1996.

Black Sea deluge theory

Flood hypothesis

In 1998, William Ryan and Walter Pitman, geologists from Columbia University, published evidence that a massive flood through the Bosporus occurred about 5600 BC. Glacial meltwater had turned the Black and Caspian Seas into vast freshwater lakes, while sea levels remained lower worldwide. The freshwater lakes were emptying their waters into the Aegean Sea. As the glaciers retreated, rivers emptying into the Black Sea reduced their volume and found new outlets in the North Sea, and the water levels lowered through evaporation. Then, about 5600 BC, as sea levels rose, Ryan and Pitman suggest, the rising Mediterranean finally spilled over a rocky sill at the Bosporus. The event flooded 155,000 km2 (60,000 sq mi) of land and significantly expanded the Black Sea shoreline to the north and west. Ryan and Pitman wrote:

"Ten cubic miles [42 km3] of water poured through each day, two hundred times what flows over Niagara Falls. …The Bosporus flume roared and surged at full spate for at least three hundred days."

The review of sediments in the Black Sea in 2004 by a pan-European project (Assemblage – Noah Project) was compatible with the conclusion of Pitman and Ryan. Calculations made by Mark Siddall predicted an underwater canyon that was actually found.

Criticism

Countering the hypothesis are data collected by Ukrainian and Russian scientists, such as the research of Valentina Yanko-Hombach, a geology professor of Odessa State University, Ukraine. Her findings predate the publication of the Black Sea deluge hypothesis.

Yanko-Hombach claims that the water flow through the Bosporus repeatedly reversed direction over geological time depending on the relative water levels of the Aegean Sea and the Black Sea. This contradicts the proposed catastrophic breakage of a Bosporus sill on which Ryan and Pitman base their hypothesis. Likewise, the water levels calculated by Yanko-Hombach were different by a wide margin from those hypothesized by Ryan and Pitman.

In 2007, Yanko-Hombach, now president of the Avalon Institute of Applied Science in Winnipeg, Canada, published a scientific volume featuring 35 papers by an international group of Black Sea scientists, including her own research on this topic. The book makes available much of the earlier Russian research in English for the first time, and combines it with more recent scientific findings.

As of 2006, a cross-disciplinary research project funded by UNESCO and the International Union of Geological Sciences continued.

A report on recent research in National Geographic News in February 2009 reported that the flooding might have been "quite mild".

Archaeology

Although neolithic agriculture had by that time already reached the Pannonian plain, the authors link its spread with people displaced by the postulated flood ("Atlantis" by David Gibbins provides an entertaining fictional account of this view). More recent examinations by oceanographers such as Teofilo A. "Jun" Abrajano Jr at Rensselaer Polytechnic Institute and his Canadian colleague Ali Aksu of Memorial University of Newfoundland have cast some doubt on this catastrophic flood hypothesis. Abrajano's team, finding sapropel mud deposits in the Sea of Marmara, have concluded that there has been sustained interaction between the Mediterranean and the Black Sea for at least 10,000 years:

"For the Noah's Ark Hypothesis to be correct, one has to speculate that there was no flowing of water between the Black Sea and the Marmara Sea before the speculated great deluge. We have found this to be incorrect."

In a series of expeditions, a team of marine archeologists led by Robert Ballard identified what appeared to be ancient shorelines, freshwater snail shells, drowned river valleys, tool-worked timbers, and man-made structures in roughly 300 feet (100 m) of water off the Black Sea coast of modern Turkey. Radiocarbon dating of freshwater mollusk remains indicated an age of about 7,000 years. However, one should note that radiocarbon dating in freshwater mollusks in particular can be inaccurate.

According to a report in New Scientist magazine (4 May 2002, p. 13), the researchers found an underwater delta south of the Bosporus. There was evidence for a strong flow of fresh water out of the Black Sea in the 8th millennium BC.

The review of sediments in the Black Sea coming from a series of expeditions carried out from 1998 to 2005, firstly in the frame of a collaborative project between France (Ifremer) and Romania (GeoEcoMa), then followed by a pan-European project (Assemblage) coordinated by Gilles Lericolais, confirmed the conclusion of Pitman and Ryan. These results were also completed by the Noah project led by the Bulgarian Institute of Oceanology (IO-BAS). Furthermore, calculations made by Mark Siddall predicted an underwater canyon that was actually found. .

Other deluges

As the Ice Age retreated, other basins refilled as sea levels rose. Some refilled too slowly to be perceptible in a human life-span, such as the Aegean Basin which presents no defined sill to be breached. Others must have refilled rapidly, in cases where a sill was breached. A comparable refilling in the region of the Near East was the refilling of the flat basin of the lower Tigris-Euphrates across the Straits of Hormuz that is now occupied by the Persian Gulf and also across the Bab-el-Mandeb barrier of the Red Sea.

Other flood accounts

The proposed deluge has been connected with various Great Flood myths, notably Noah's Flood. Fundamentalist Christians claimed that "Noah's Flood was not a local flood in the Black Sea area, but a world-wide flood that has left its mark on every continent on this planet", and that the timing was wrong. On the other hand, Hershel Shanks, editor of the Biblical Archaeology Review, said that "if you want to see the Black Sea flood in Noah's flood, who's to say no?"

From http://en.wikipedia.org/

Black Sea

Black Sea

The Black Sea is an inland sea bounded by Europe, Anatolia and the Caucasus and is ultimately connected to the Atlantic Ocean via the Mediterranean and Aegean Seas and various straits. The Bosporus strait connects it to the Sea of Marmara, and the strait of the Dardanelles connects it to the Aegean Sea region of the Mediterranean. These waters separate eastern Europe and western Asia. The Black Sea also connects to the Sea of Azov by the Strait of Kerch.

The Black Sea has an area of 436,400 km² (168,495 sq mi), a maximum depth of 2,212 m (7,257 ft), and a volume of 547,000 km³ (133,500 cu mi). The Black Sea forms in an east-west trending elliptical depression which lies between Bulgaria, Georgia, Romania, Russia, Turkey, and Ukraine. It is constrained by the Pontic mountain range to the south, the Caucasus mountain range to the east and features a wide shelf to the north-west. The longest east-west extent is about 1,175 km.

Important cities along the coast include: Constanţa (306,000 with a metropolitan area of 550,000), Istanbul (11,372,613), Odessa (1,001,000), Mangalia (41,153), Burgas (229,250), Varna (357,752 with a metropolitan area of 716,500), Kherson (358,000), Sevastopol (379,200), Yalta (80,552), Kerch (158,165), Novorossiysk (281,400), Sochi (328,809), Sukhumi (43,700), Năvodari (34,669), Poti (47,149), Batumi (121,806), Trabzon (275,137), Samsun (439,000) Ordu (190,143) and Zonguldak (104,276).

Black Sea

The Black Sea has a positive water balance, which results in a net outflow of water 300 km³ per year through the Bosphorus into the Aegean Sea (part of the Mediterranean Sea). Mediterranean water flows into the Black Sea as part of a 2-way hydrological exchange. The Black Sea outflow is less salinated and cool, therefore floats over the warm, relatively more salinated Mediterranean inflow. The Black Sea also receives river water from large Eurasian fluvial systems to the north of the Sea, of which the Don, Dnieper and Danube are the most significant.

In the past, the water level has varied significantly. Depending on the water level in the basin, more or less of the surrounding shelf and associated aprons are aerially exposed. At certain critical depths, it is possible for connections with surrounding water bodies to become established. It is through the most active of these connective routes, the Turkish Straits System (TSS), that the Black Sea joins the global ocean system. When this hydrological link is not present, the Black Sea is a lake, operating independently of the global ocean system. Currently the Black Sea water level is relatively high, thus water is being exchanged with the Mediterranean. The TSS connects the Black and Aegean Seas and comprises the Strait of Bosphorus (Strait of Istanbul), the Marmara sea and the Strait of Dardanelles (Hellespont, Strait of Canakkale).

From http://en.wikipedia.org/

Bio-geoengineering

Bio-geoengineering is a form of geoengineering which seeks to use or modify plants or other living things to modify the Earth's climate.

Bio-energy with carbon storage, afforestation projects, and ocean nourishment (including iron fertilization) could be considered examples of bio-geoengineering.

From http://en.wikipedia.org/

Avoiding Dangerous Climate Change

Avoiding Dangerous Climate Change

Avoiding Dangerous Climate Change: A Scientific Symposium on Stabilisation of Greenhouse Gases was a 2005 international conference that examined the link between atmospheric greenhouse gas concentration, and the 2 °C (3.6 °F) ceiling on global warming thought necessary to avoid the most serious effects of global warming. Previously this had generally been accepted as being 550 ppm.

The conference took place under the United Kingdom's presidency of the G8, with the participation of around 200 'internationally renowned' scientists from 30 countries. It was chaired by Dennis Tirpak and hosted by the Hadley Centre for Climate Prediction and Research in Exeter, from 1 February to 3 February.

Avoiding Dangerous Climate Change

Objectives

The conference was called to bring together the latest research into what would be necessary to achieve the objective of the 1992 United Nations Framework Convention on Climate Change:

to achieve, in accordance with the relevant provisions of the Convention, stabilization of greenhouse gas concentrations in the atmosphere at a level that would prevent dangerous anthropogenic interference with the climate system.

It was also intended to encourage further research in the area. An initial assessment of the subject had been included in the 2001 IPCC Third Assessment Report; however, the topic had received relatively little international discussion.

Specifically, the conference explored three issues:

* For different levels of climate change what are the key impacts, for different regions and sectors and for the world as a whole?
* What would such levels of climate change imply in terms of greenhouse gas stabilisation concentrations and emission pathways required to achieve such levels?
* What options are there for achieving stabilisation of greenhouse gases at different stabilisation concentrations in the atmosphere, taking into account costs and uncertainties?

Avoiding Dangerous Climate Change

Conclusions

Among the conclusions reached, the most significant was a new assessment of the link between the concentration of greenhouse gases in the atmosphere and the increase in global temperature levels. Some researchers have argued that the most serious consequences of global warming might be avoided if global average temperatures rose by no more than 2 °C (3.6 °F) above pre-industrial levels (1.4 °C above present levels). It had generally been assumed that this would occur if greenhouse gas concentrations rose above 550 ppm carbon dioxide equivalent by volume. This concentration was, for example, informing government in certain countries, including the European Union.. Other research suggests, however, that 2 °C warming is unlikely to cause major economic problems.

The conference concluded that, at the level of 550 ppm, it was likely that 2 °C would be exceeded, according to the projections of more recent climate models. Stabilising greenhouse gas concentrations at 450 ppm would only result in a 50% likelihood of limiting global warming to 2 °C, and that it would be necessary to achieve stabilisation below 400 ppm to give a relatively high certainty of not exceeding 2 °C.

The conference also claimed that, if action to reduce emissions is delayed by 20 years, rates of emission reduction may need to be 3 to 7 times greater to meet the same temperature target.

Reaction

As a result of changing opinion on the 'safe' atmospheric concentration of greenhouse gases, to which this conference contributed, the UK Government has now agreed to change the target in the forthcoming Climate Change Bill from 60% to 80% by 2050.

From http://en.wikipedia.org/

Attribution of recent climate change

Attribution of recent climate change

Attribution of recent climate change is the effort to scientifically ascertain mechanisms responsible for relatively recent changes observed in the Earth's climate. The effort has focused on changes observed during the period of instrumental temperature record, when records are most reliable; particularly on the last 50 years, when human activity has grown fastest and observations of the upper atmosphere have become available. The dominant mechanisms to which recent climate change has been attributed all result from human activity. They are:

* increasing atmospheric concentrations of greenhouse gases
* global changes to land surface, such as deforestation
* increasing atmospheric concentrations of aerosols.

Recent reports from the Intergovernmental Panel on Climate Change (IPCC) report have concluded that:

* "Most of the observed increase in globally averaged temperatures since the mid-20th century is very likely due to the observed increase in anthropogenic greenhouse gas concentrations."
* "From new estimates of the combined anthropogenic forcing due to greenhouse gases, aerosols, and land surface changes, it is extremely likely that human activities have exerted a substantial net warming influence on climate since 1750."
* "It is virtually certain that anthropogenic aerosols produce a net negative radiative forcing (cooling influence) with a greater magnitude in the Northern Hemisphere than in the Southern Hemisphere.

The panel, which represents consensus in the scientific community, defines "very likely," "extremely likely," and "virtually certain" as indicating probabilities greater than 90%, 95%, and 99%, respectively.

From http://en.wikipedia.org/

User:Atmoz/Climate change feedbacks

User:Atmoz/Climate change feedbacks

Climate change feedbacks are processes in the climate system that either augment or diminish the systems response to a climate forcing. The increase in atmospheric greenhouse gases is an anthropogenic forcing that increases the temperature of the surface. This recent increase in surface temperatures and its projected continuation is called global warming. The International Panel on Climate Change in its fourth assessment reported a climate sensitivity to be likely in the range of 2 to 4.5 °C for a doubling of atmospheric carbon dioxide. The uncertainty is largely due to differences in the how different global climate models incorporate and parameterize each of the climate feedbacks.

From http://en.wikipedia.org/

Asia-Pacific Emissions Trading Forum

The Asia-Pacific Emissions Trading Forum, otherwise known as the AETF, is an information service and business network dealing with domestic and international developments in emissions trading policy in the Asia-Pacific region. The AETF was originally called the Australasian Emissions Trading Forum, and was founded in 1998 under the auspices of the Sydney Futures Exchange. Since 2001 the AETF has published the AETF Review six times a year. This publication includes original articles on emissions trading developments and related topics.

Emissions trading is a key element of the Kyoto Protocol, and national and regional schemes are operating in the European Union and New Zealand, and are under active consideration in Australia, Japan, and most recently, in the United States. International climate negotiations are currently underway and will culminate at the United Nations Climate Change Conference 2009 in Copenhagen, under the auspices of the United Nations Framework Convention on Climate Change.

Australia’s Carbon Pollution Reduction Scheme

The policy and legislative background

The Rudd Government’s Carbon Pollution Reduction Scheme (CPRS) White Paper represents the culmination of an unprecedented policy development effort in Australia, supported by the most detailed economic modelling undertaken by the Department of the Treasury (Australia).

The December 2008 White Paper was one milestone towards the Government's ultimate policy objective of implementing a cost effective and forward looking climate policy, which fully accounts for Australia’s particular environmental, economic and geopolitical situation. The exposure CPRS legislation, released in March 2009, converted the policy positions of the White Paper into legislative format.

The legislation and Parliament

The Parliamentary Secretary for Climate Change, Greg Combet, presented the legislation to Parliament on 14 May 2009. The passage of this legislation will depend critically on the support of other parties for passage through the Senate.

Australia’s emissions reduction target

On 4 May 2009 the Rudd Government announced a new, aspirational target for Australian emissions reductions. The Government has committed to reduce emissions to 25 per cent below 2000 levels by 2020 if an international agreement, stabilising greenhouse gases in the atmosphere at 450 parts per million CO2 equivalent or lower by 2050, is achieved.

Before this announcement, Australia was committed to an unconditional 5 per cent reduction below 2000 levels, and a conditional 15 per cent reduction below 2000 levels, if an international agreement commits major developing economies to substantially restrain emissions, and developed economies to take on reductions comparable to Australia.

International emissions trading developments

The legislative process in Australia is being undertaken in an environment of continuing uncertainty because the future international policy regime remains unresolved, and ultimately Australia’s national emissions reduction target is dependent on this international regime.

Australia is not the only country introducing emissions trading legislation. In the United States, the American Clean Energy and Security Act, otherwise know as the Waxman-Markey Bill (after Democratic politicians Henry Waxman and Ed Markey), was introduced to the House in mid-May 2009. The Bill was passed on 21 May 2009, by 33 votes to 25.

The Bill proposes to reduce American emissions by 3 per cent of 2005 levels by 2012, 17 per cent by 2020, 42 per cent by 2030, and 83 per cent by 2050. These reduction targets are consistent with stabilisation at 450ppm CO2-e, although the original proposed target of 20 per cent of 2005 levels by 2020 was negotiated down to 17 per cent.

The recent UN Climate Conference in Poland (COP14) did little to move international negotiations ahead, although there are hopes for a more decisive meeting in Copenhagen (COP15) in late 2009.

From http://en.wikipedia.org/

Arctic shrinkage

Arctic shrinkage

Arctic shrinkage is the decrease in size of the Arctic region (as defined by the 10 °C (50 °F) July isotherm). This is a change in the regional climate as a result of global warming. Recent projections of sea ice loss suggest that the Arctic ocean will likely be free of summer sea ice sometime between 2059 and 2078. Because of the rapid response of the Arctic to global warming, it is often seen as a high-sensitivity indicator of climate change. Scientists also worry about the potential release of methane from the arctic region, especially through the thawing of permafrost and methane clathrates, which could be released to the atmosphere and accelerate global warming, as methane is a powerful greenhouse gas.

From http://en.wikipedia.org/

Arctic geoengineering

Temperatures in the Arctic region have tended to increase more rapidly than the global average. Projections of sea ice loss that are adjusted to take account of recent rapid Arctic shrinkage suggest that the Arctic will likely be free of summer sea ice sometime between 2059 and 2078. Various geoengineering schemes have been suggested to reduce the chance of significant and irreversible effects such as Arctic methane release.

Several geoengineering proposals have been made which are specific to the Arctic. They are usually hydrological in nature, and principally centre upon measures to prevent Arctic Ice Loss. These are detailed below.

In addition, other solar radiation management geoengineering techniques, such as stratospheric sulfur aerosols have been proposed. These will cool the Arctic by adjusting the albedo of the atmosphere.

Arctic geoengineering

Background

The Arctic region plays an important role in the regulation of the Earth's climate. Conditions in the Arctic may suggest the existence of tipping points, including ice-albedo feedback from melting Arctic sea ice and Arctic methane release from melting permafrost and methane clathrat. The speed of future retreat of the Arctic sea ice is contentious. The IPCC Fourth Assessment Report of 2007 states that "in some projections, Arctic late-summer sea ice disappears almost entirely by the latter part of the 21st century." However, the ice has since undergone unexpectedly significant retreat, reaching a record low area in summer 2007 before recovering somewhat in 2008.

A 'tipping' process could potentially commence as the Arctic region warms, if there is positive feedback with sufficient gain. Professor Tim Lenton suggests that the retreat of sea ice is such a process, and the tipping may have started already. Geoengineering has been proposed for preventing or reversing tipping point events in the Arctic, in particular to halt the retreat of the sea ice.

Preventing such ice loss is important for climate control, as the Arctic Ice regulates global temperatures by virtue of its albedo, and also by restraining methane emissions from permafrost near the shoreline in the Arctic region. Additionally, the sea ice has a wider regional climatic role, and acts to maintain permafrost more generally in the region, by insulating the cold winter winds from the warm sea.

Building thicker sea ice

It has been proposed to actively enhance the polar ice cap by spraying or pumping water onto the top of it which would build thicker sea ice. As ice is an insulator, water on the surface of the ice tends to freeze more quickly than that below. River water could be used for this purpose, as salt water tends to resist freezing, and may end up perforating the resulting ice sheet.

Thickening ice by spraying seawater onto existing ice has been proposed. Sea ice is an effective thermal insulator, and thus freezing takes place much more rapidly on the top surface of the ice sheet than on the bottom. Thicker sea ice is more structurally stable, and is more resistant to melting due to its increased mass. An additional benefit of this method is that the increased salt content of the melting ice will tend to strengthen downwelling currents when the ice re-melts.

Stratospheric sulfur aerosols

Ken Caldeira et al. analysed the effect of geoengineering in the Arctic using Stratospheric sulfur aerosols This technique is not specific to the Arctic region. He found that At high latitudes, there is less sunlight deflected per unit albedo change but climate system feedbacks operate more powerfully there. These two effects largely cancel each other, making the global mean temperature response per unit top-of-atmosphere albedo change relatively insensitive to latitude.

From http://en.wikipedia.org/